
Tool 3
Building Your Impact Story
Review your plans and findings and prepare the report or story you need
Pre-publication version. PQMD is finalising the text. Layout, navigation and tools are ready for review.
Module 6
How do we explain the outcomes of our work and what they mean for people and care?
An impact story brings together the change a program seeks, the results over time and the experiences of the people involved. It explains what donated products and partnerships contributed, what helped the result and where further work could make a difference. Start with your program’s purpose and the outcomes that matter to your organization and partners.
Delivery and reach figures describe the scale of your work. Outcome measures help you understand what changed or was sustained. Measure the same outcome across comparable periods so you can see progress, maintenance, decline or differences between settings. Even availability becomes a fuller story when you track how closely supply meets priority demand over time.
AMI offers three shared impact areas: Increase Availability of Priority Products; Sustain Continuity of Care; and Expand Capacity to Deliver Care. Use the relevant metric cards alongside other defined outcomes that reflect your program. Each story can connect with the areas that fit its purpose.
Availability
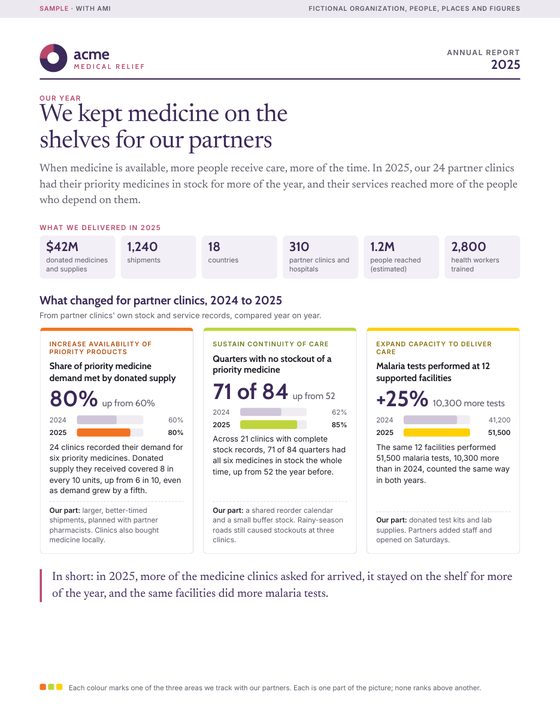
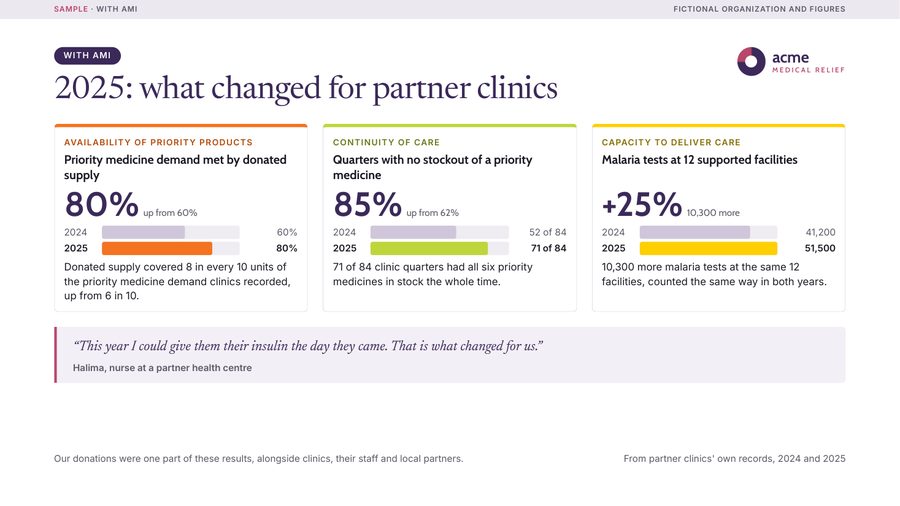
the share of a clinic’s recorded priority medicine demand met through donated supply rose from 60% in Year 1 to 80% in Year 2, while demand increased. The story can explore how product selection, quantities and timing changed and what the remaining gap meant for care.
Continuity
over a two-year review, a clinic had nine stockout-free months in the first year and 11 in the second. The story can explain what more reliable supply meant for refill arrangements and how donated products, purchasing and local planning contributed.
Capacity
a facility delivered 2,400 defined diagnostic tests in Year 1 and 3,000 in Year 2, a 25% increase in service volume. The story can examine how equipment, consumables, staff and maintenance contributed to that increase and which access barriers remained.
Keep definitions, units, locations and period lengths comparable. Show the starting and later values alongside the change. A first observation establishes a baseline for the next review. Track meaningful maintenance as well as improvement, with context about demand and operating conditions.
Patients, caregivers, providers, supply teams and local partners can explain how the program worked in practice. Their experiences may reveal a change the metric misses, explain a pattern or lead you to reconsider an initial conclusion. Include perspectives from people with different experiences. Tool 4 provides the working questions, recording sheets and detailed guidance.
Review the records and stories together. Be clear about what was measured, what people described and what you conclude. Check the assumptions behind the comparison, including complete records, consistent definitions, other sources of supply and whose experiences are represented. Record what has been checked and what still needs investigation.
Connect the findings to the outcome your program seeks. For example, stock records show product availability; provider and patient accounts help explain the experience of obtaining refills. Each adds a different part of the story. Credit local leadership, donated products and the other support that shaped the result.
Decide who will use the findings and what they need to understand. A program report may explain progress against outcomes; a partner discussion may focus on what to change; a leadership brief may support a resource decision; a public story may describe a person’s experience alongside the wider result. Keep the underlying finding and its scope consistent across formats.
Agree the audience, timing, roles, requested content and review process early. Build on existing reporting arrangements and discuss the staff time, translation, collection and other costs with partners. Shared planning helps each organization use the same information well.
Sample impact report and slides
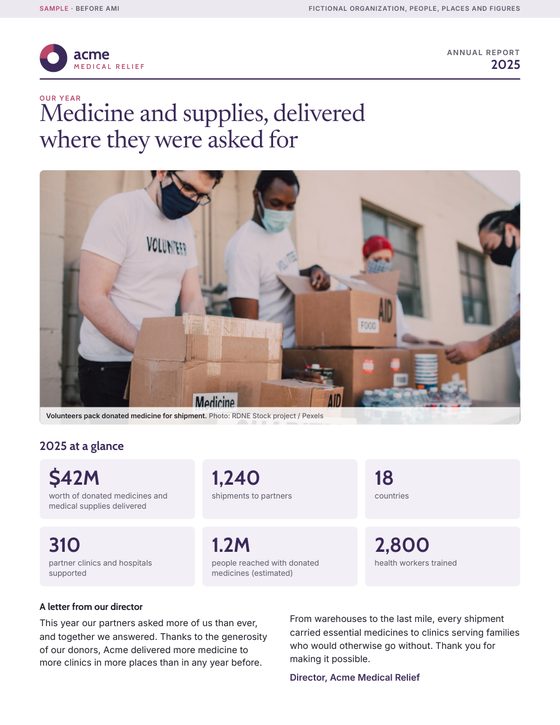
A made-up organization's 2025 report, first as many reports read today, then with outcome measures added to the same outputs. Every name, place and figure is invented.
Explain the purpose and intended uses, protect voluntary participation and record permissions for recording, quotations and images. Give contributors an opportunity to review their representation. Show people’s knowledge, choices and agency; recognize local leadership and the partners involved. Protect personal information, check translations and follow local consent and safeguarding procedures. Return the finished story or findings to contributors in an accessible form.
Tool 3 is a review of the purpose, measures and partner decisions developed through the earlier tools. It brings the findings into a report or story. Tool 4 supports gathering and checking experiences, with a separate AMI Storytelling Reference Guide for detailed methods and examples. Together, they help you identify what to sustain, what to adjust and what further support could help the program achieve its intended outcomes.
Tool 3
Review your plans and findings and prepare the report or story you need
Tool 4
Working pages for gathering and checking people’s experiences